An Introduction to Buffer Overflow #3 : (Un)Winding of Stack
In the third part of the Buffer Overflow series, Gurkirat Singh delivers a detailed explanation on how to (un)wind a stack and prevent a type of buffer overflow attack called stack canaries. Pentesters and security enthusiasts will love this!


Hello World! Almost after 3 years, I am back with my Buffer Overflow series again here. I wish I could have finished it earlier, but let's do that now. I had planned to explain x64 (64 bit) architecture in previous posts, but I recently received course material access from Pentester Academy which is on x86 (32 bit) and wanted to share the knowledge without sharing the course materials.
The knowledge you gained from Introduction and Code Execution in RAM will be the same; you simply need to think in terms of 32-bit (4 bytes) rather than 64-bits (8 bytes).
Working of Stack Explained (Again)
To get the practical knowledge of how stack actually works between function calls and returns, I will give you a detailed demonstration of a program that calls 3 functions nested within each other, from the main function, and then returns values.
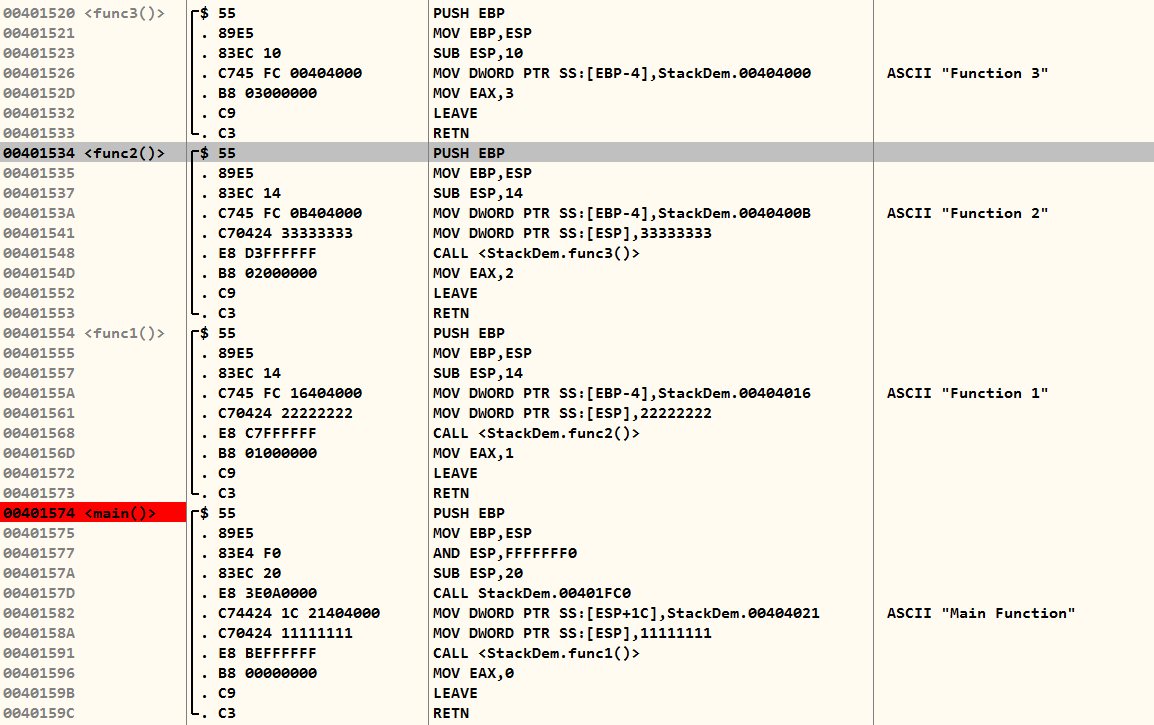
When the CALL instruction is executed, it pushes the address of the next instruction of caller function onto stack, and then changes the EIP to the callee function's first instruction. In the screenshot I shared above, on executing instruction at 0x00401591, it will push the address 0x00401596 to stack, so that machine knows where to continue from when the callee returns.
These first three lines of instructions of every function is called prologue, which is responsible for preserving the stack base pointer of caller and providing information of current function's base pointer. Sometimes, they also contain additional instructions to prevent buffer overflow attacks, known as stack canaries. If you're wondering "Why?" Pat yourself on the back first, and you'll see why in a few minutes.
PUSH EBP
MOV EBP, ESP
SUB ESP, 10 ; size depends on function and local variables__cdecl calling conventionA base pointer basically contains the value of the callee function's stack starting point (remember, stack grows upwards, which is a high to a low memory address). Then, using EBP - <offset>, you can access local members, and using EBP + <offset>, you can access arguments passed by the caller function.
Stack Winding
When you load the program into the debugger, it will point to the Module Entrypoint (here, Executable), which in this case is _start. I had set the break point on the main function prologue, to stop execution, as soon it does housekeeping for main function and calls the function.
Note – Main function is not the actual entrypoint, it is called application's entry point for a reason.
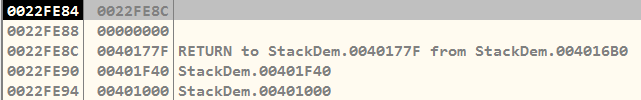
The CALL instruction is now the one that the EIP is pointing to, indicating that it will be carried out next. If you look at the stack now, you'll notice that the address of the string from memory is assigned to the ESP + 0x1C address, which is 0x0022FEBC, with the value 0x00404021.
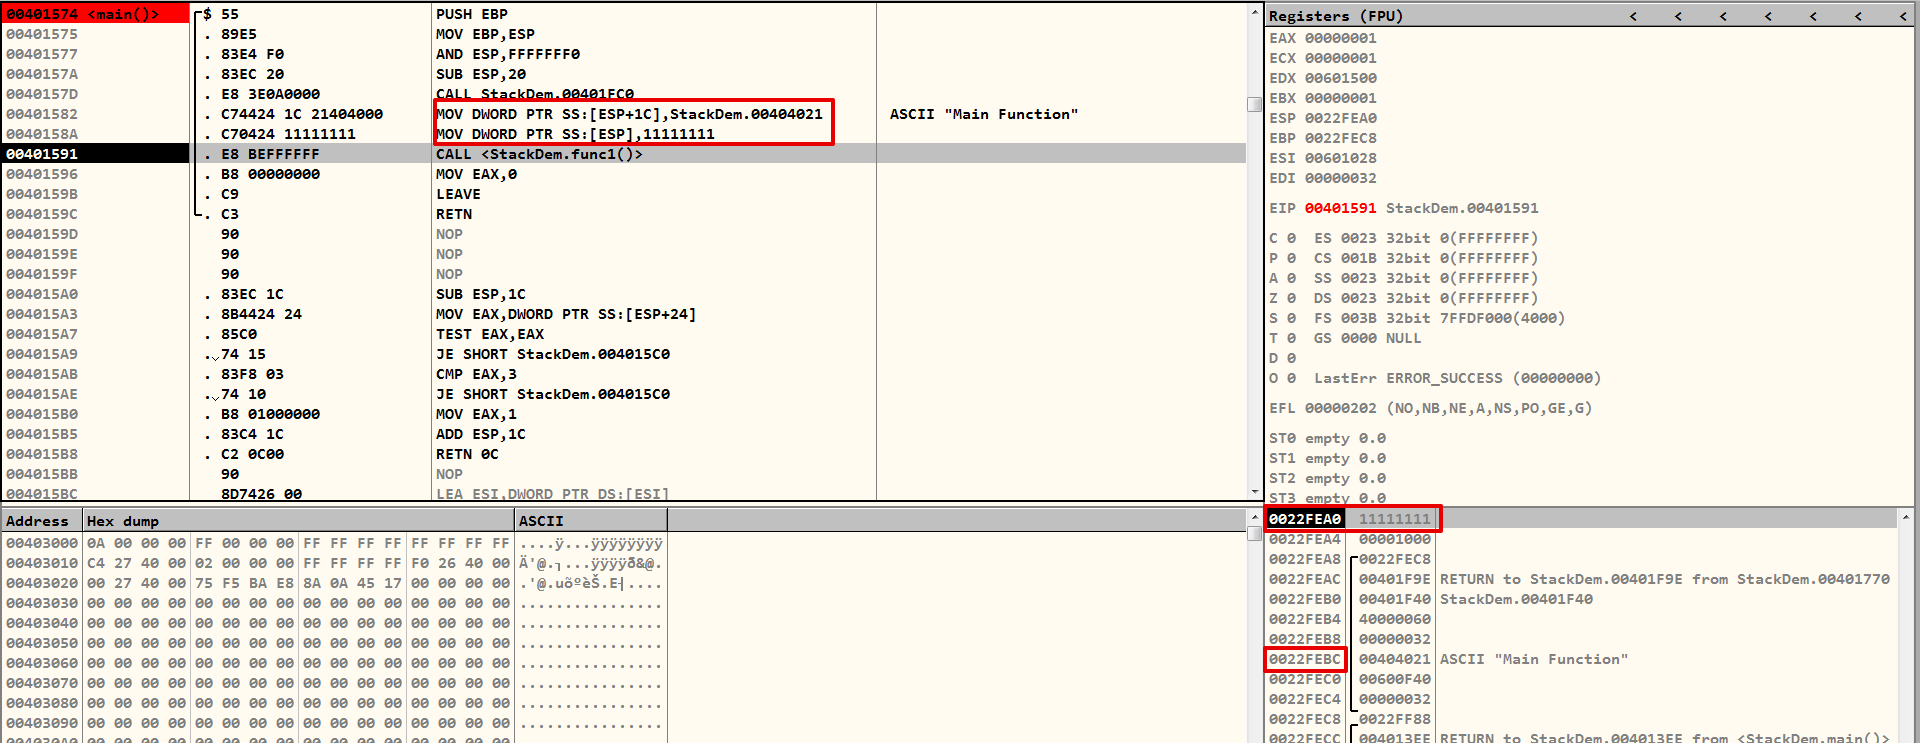
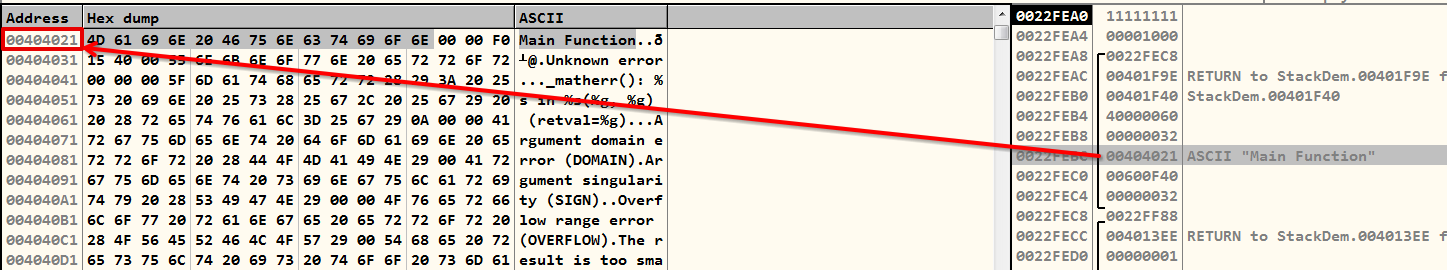
func1()Actually, you can press CTRL + G and go to this address in the memory, where you will find the same string message along with NULL byte \x00.
So I have executed the function prologue and the function is about to initialise the values of its local variable now.
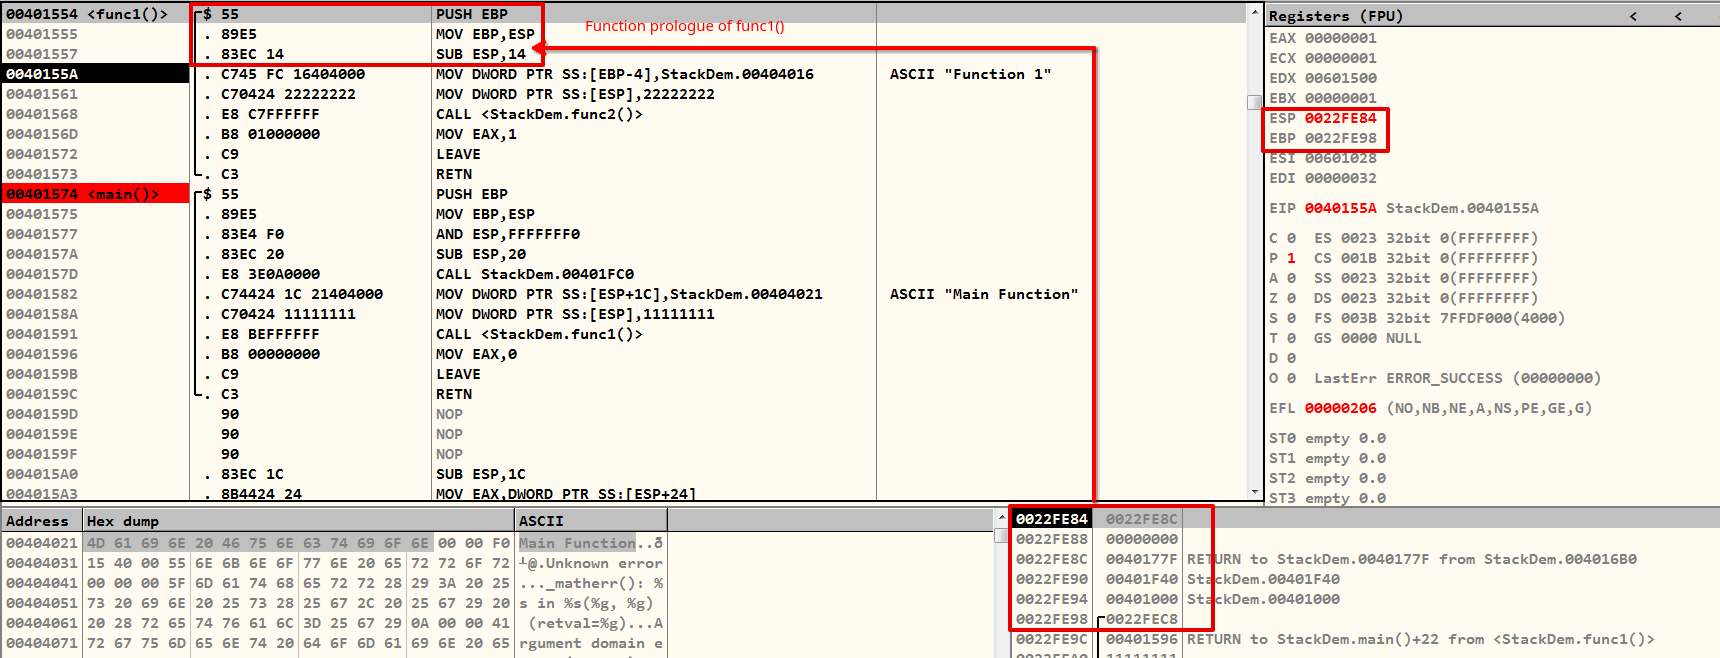
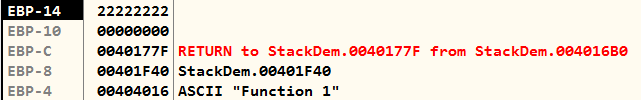
The PUSH EBP instruction preserved the stack frame base of the main() function in place, and the MOV EBP, ESP instruction has set the base of the current function. This means that the func1() function should now be considered from EBP, which is 0x0022FE98. Another way to put it is that anything that the function would write to the stack is now somewhere in this location.
func1()So, I ran those two MOV instructions right after the prologue, and as you can see, it did indeed write in its allocated space.
As a result, when I execute the CALL instructions again, the same thing will happen as when it was moved from main to func1 function. In this case, the stack return address would be 0x0040156D, and so on.
Stack winding is the process of arranging the stack for a function call, ensuring correct execution and memory management.
Stack Unwinding
The stack unwinding is the reverse of what you've observed in the winding section, and yes, when the function returns and how things change on the stack and registers, that is what defines the unwinding process. Now you will realise why learning this whole concept is important before actually exploiting buffer overflows.
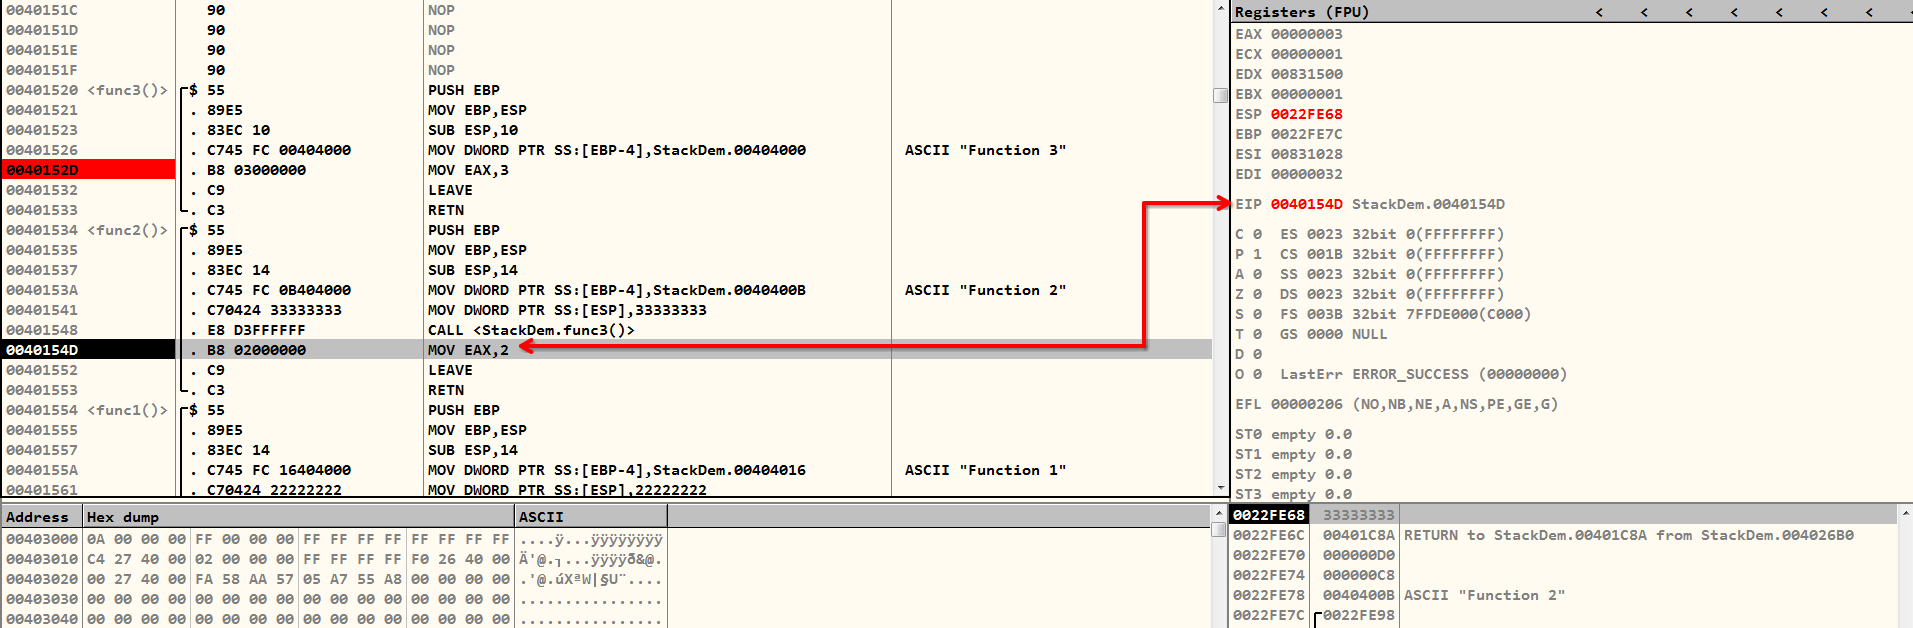
So let's start with function 3, where I have paused on the MOV EAX, 3 instruction. This is how the function defined its return value. So let's say in C++ you have written return 0xDEADBEEF, that would be MOV EAX, 0xDEADBEEF in the assembly.
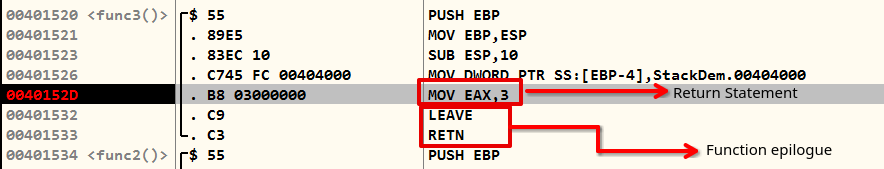
The MOV instruction is simple; it will just set the value of the EAX register to 0x3. The interesting part is what would happen when LEAVE and RETN instructions were executed. These two instructions together (sometimes with stack canaries) are called the function's epilogue.
After a function execution, the ESP is now pointing to the EBP, which is then restored to its original value EBP. This action restores the stack frame base of the previous caller function, in this case, func2(). To better understand the steps of LEAVE in terms of MOV and POP, we can break it down to two simpler operations as shown below:
MOV ESP, EBP
POP EBP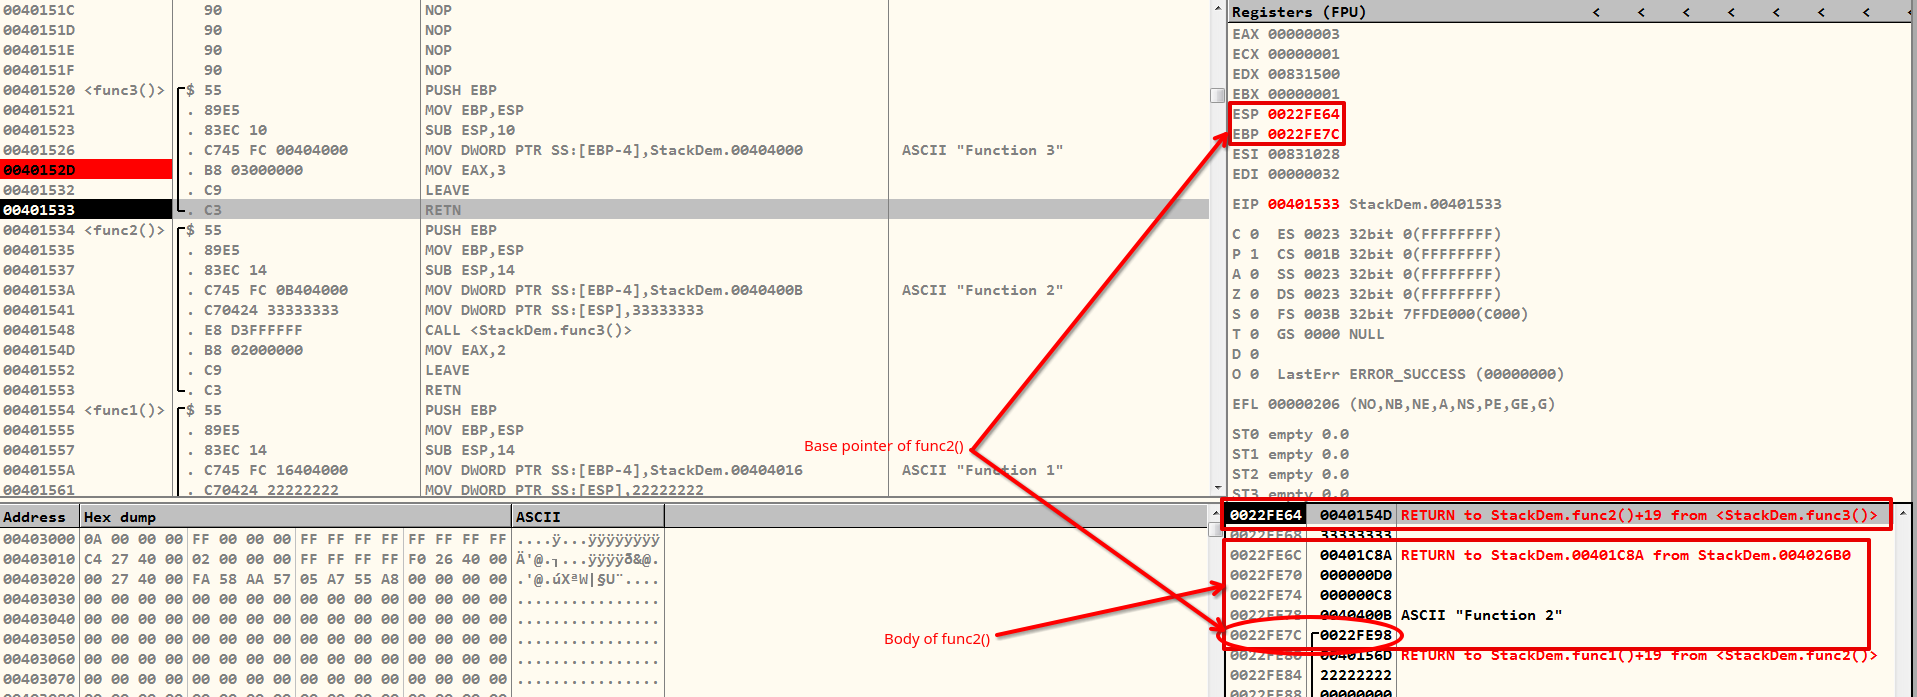
LEAVE instruction.To proceed to the next instruction in the caller function, the EIP must be the value that ESP is currently pointing to. The RETN instruction does the same thing. You can think of it in pseudocode form as the following:
POP EIPThis is not a real instruction in x86 assembly, only used for explanation purpose.
Allow me to help you if this hasn't rung a bell in your mind. If we can somehow overflow the stack just enough that RETN pops the overwritten value, then EIP will now point to the beginning of our arbitrary code (or shell-code).
That is the end of this lesson now. Feel free to reach out via the contact info below.
Contact Me
I would love to hear from you regarding questions about the topic or suggestion on how can I improve my technical writing, or you want to discuss Anime and technology with me, feel free to reach via any channel
Email: tbhaxor at proton dot me
Twitter: @tbhaxor
Linkedin: @tbhaxor
I also publish interesting content on my blog, https://tbhaxor.com/. Please give it a look.
References


 Contributors to Wikimedia projects