A Guide to Malware Analysis: Day 3
Get deeper into malware analysis with security researcher fairycn and learn about dll injection, how to use the Huorong System Diagnostics Toolkit for monitoring, and how malware leverages networks for remote attacks.


Note: This article is an English translation of an article written in another language. If you have are having trouble reading it, I will improve the translation
On the third day of malware analysis, I will give you a brief understanding of the virus dynamic analysis technology in this article. If there are any inappropriate points or inaccuracies, it is my hope that those reading this can point them out. Let us work together as partners and collectively improve and progress!
FYI: The contents of the article reflects the author's knowledge base and personal understanding, which may not necessarily be accurate. It is my hope that readers will use it as a reference, while keeping an open mind and not limiting their thinking to it.
Knowledge base
Advantages
Some viruses are identified as normal during static analysis, but will actually behave maliciously at runtime, so dynamic analysis techniques are often used to close the loop (virus creators often circumvent virus analysis software by applying static anti-virus processing to viruses on the way to creation).
Virtual Environment
Security considerations, most dynamic analysis is carried out in virtual machines.
Causes
Because unknown computer viruses are full of uncertainty, it is necessary to run computer viruses and monitor their behaviour when carrying out dynamic analysis. Moreover, security considerations require a safe and controlled operating environment to reduce the harm caused by viruses.
Examples of common hazards:
Common Virtual Machine Software
- Vmware
- VirtulBox
- Hyper-V
- Parallels
- Xen
- QEMU
- Android emulators (too many of these to single out)
Drawbacks
As the virtual environment is not real, there are some limitations or drawbacks.
Examples of common limitations or drawbacks:
Behavioural monitoring
When a virus is harmful, it will often perform some malicious or dangerous actions.
Examples of common behaviours that can be used for analysis:
- Network behaviour
Sending network connection requests, remote control, downloading malicious code, local data listening, transferring sensitive data, etc. - System modifications
Boot up, create scheduled tasks, create hidden accounts, open ports, infect and replace system files, create and stop services, destroy the system runtime structure, modify, delete and add to the registry, etc. - Other actions
Modifying file attributes, deleting, reading, adding, encrypting, releasing files, hijacking processes, closing, detecting certain programs or processes, monitoring the operating environment, executing attack commands, etc.
Commonly used tools
Tools sourced from publicly available products, own custom development.
Software debugging
In dynamic analysis, it is common to run the analysed program through a debugger or attach the analysed process with a debugger to analyse the analysed program for malicious behaviour.
Examples of common debuggers:
- x64dbg
32/64 bit debugger for Windows - olldbg
Assembly analysis debugger - immunity debugger
Immunity Debugger is a powerful new approach to writing exploits, analysing malware and reverse engineering binaries. It is built on a solid user interface with function diagrams, the industry's first heap analysis tool built specifically for heap creation, and a large, well-supported Python API for easy extension. - windbg
The Windows debugger (WinDbg) can be used to debug kernel and user mode code, to analyse fault dumps and to check CPU registers during code execution. - dnspy
dnSpy is a debugger and editor for .NET assemblies. You can use it to edit and debug assemblies, even if you don't have any source code available! - GDB
GDB, the GNU Project Debugger, allows you to see what is going on "inside" another program while it is executing - or what another program is doing when it crashes. - drozer
The leading security assessment framework for Android - frida
A dynamic toolbox for developers, reverse engineers and security researchers - edb-debugger
edb is a cross-platform AArch32/x86/x86-64 debugger.
Monitoring category
In dynamic analysis, monitoring tools are often used to monitor what the program is doing after it has been run to analyse whether the program being analysed has malicious behaviour.
Examples of common monitoring tools:
Firewalls
- GlassWire
- FortKnox Firewall
- TinyWall
- WFN
- OpenSnitch
Network data monitoring
- Huorong System Diagnostics Toolkit
- Windows Sysinternals
- Directory Monitor
- Process Hacker
- Process Lasso
- FSMonitor
Automated malware analysis environment
- Online virus analysis sandbox
- Online antivirus engine
- Cuckoo and more
Injection technology
Process Injection
Virus developers often use process injection techniques to bypass virus protection software and add malicious functions to legitimate processes, or to read sensitive data from memory, interfere with analysis, etc.
In the Windows operating system, processes are allowed to allocate, read and write in the virtual memory of another process, as well as create new threads, suspend threads and change the registers of these threads, including instruction fingers (EIP/RIP). These are based on which code can be injected into processes (malicious use of this technique to inject malicious code into normal processes and execute it to circumvent protection software).
dll injection
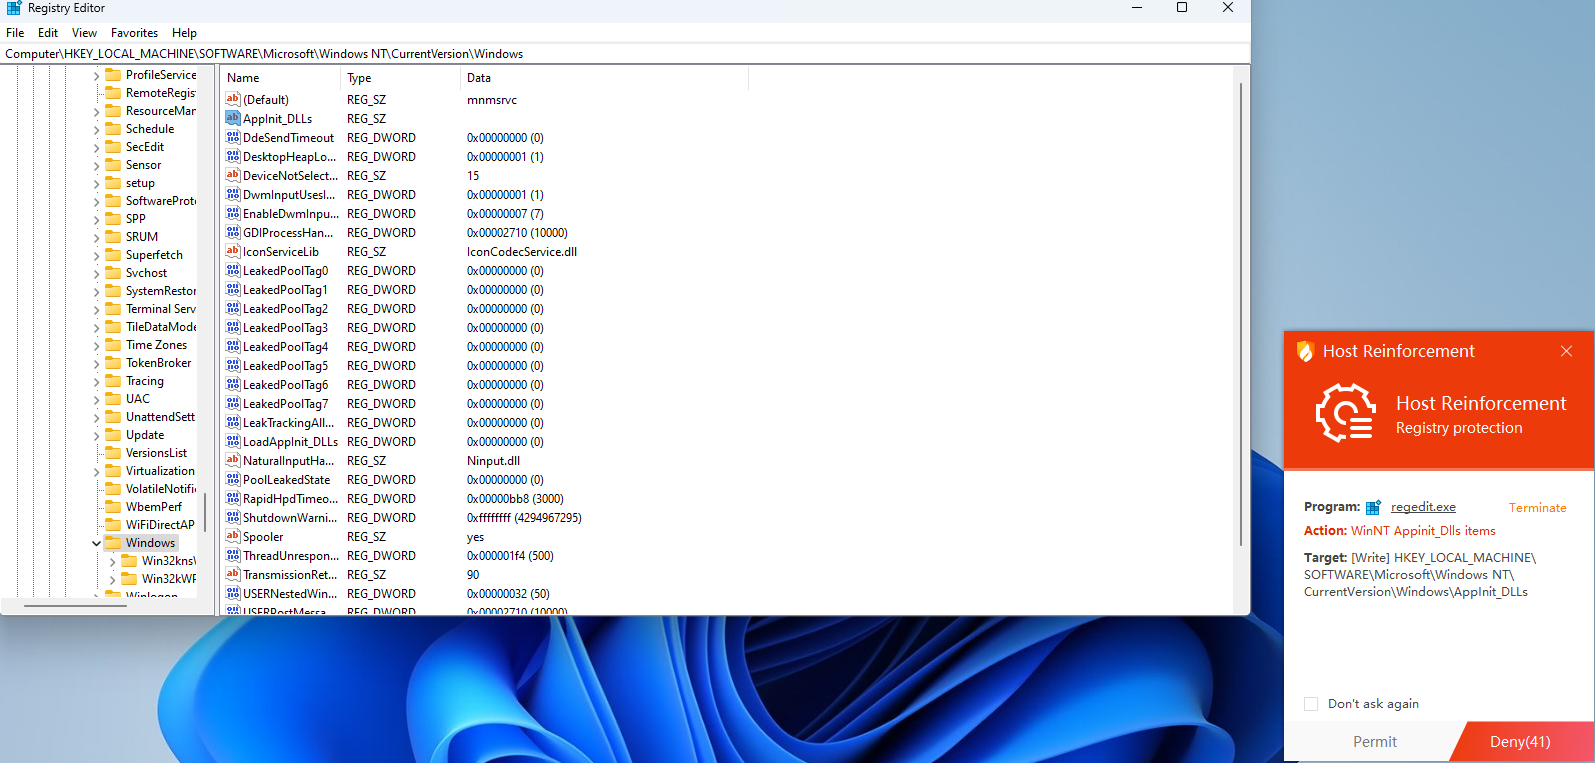
Windows has created registry entries for DLLs so that they can be loaded in processes that meet certain criteria. Many of these entries allow malware DLLs to be injected into processes, such as browsers and other normal processes. For example
HKEY_LOCAL_MACHINE\SOFTWARE\Microsoft\Windows NT\CurrentVersion\Windows\AppInit_DLLs
This registry entry is one of the most abused registry entries by malware and is used to inject DLL code into other processes and to maintain persistence. However, it requires administrator privileges to add, and Microsoft has set the LoadAppInit_DLLs value to 0 by default to prevent unknown dlls from being loaded, which can be turned off by changing the value to 1.
Principle:
Example of analysis
Demonstrate dynamic analysis techniques by running a number of samples or programs and analysing them for the presence of malicious behaviour
Registry Monitoring
Before running the program, make a backup of the registry, turn on Huorong System Diagnostics Toolkit monitoring, and after running for a while, check for registry-sensitive operations, such as:
- Modify key value has default protection turned off (HKEY_LOCAL_MACHINE\SOFTWARE\Microsoft\Windows NT\CurrentVersion\Windows\LoadAppInit_DLLs - 0x1)
Load malicious dlls
(HKEY_LOCAL_MACHINE\SOFTWARE\Microsoft\Windows NT\CurrentVersion\Windows\AppInit_DLLs value is unknown dll, normal is empty).
Attack location is monitored for:

Attack parameters:
Intercept log:
Network Related api
x64dbg loads the program and places breakpoints on common network functions to see if they can be broken (the sample program was only tested before it was run to learn of the network behavior)
- Open network analysis tool before running
Network function under break single step analysis:
As shown above: successfully broken and single-stepped to see the network address of the downloaded file Add:
UrlCanonicalizeW Function Explanation
Converts a URL string to a canonical form
LWSTDAPI UrlCanonicalizeW( PCWSTR pszUrl、 PWSTR pszCanonicalized、 DWORD *pcchCanonicalized、DWORD dwFlags。 DWORD dwFlags ); Example implementation: e.g. replacing unsafe characters with escaped sequences If the URL string contains "/... /" or "/. /", URLCononicalize treats these characters as indicating navigation in the URL hierarchy. This function simplifies the URL before merging it, for example "/hello/craul/. /world" is reduced to "/hello/world".Other API functions:
In Windows, programs using network functions often use functions in the ws2_32.dll dynamic link library
accept
bind
closesocket
connect
freeaddrinfo
getaddrinfo
gethostbyaddr
gethostbyname
gethostname
getnameinfo
getpeername
getprotobyname
getprotobynumber
getservbyname
getservbyport
getsockname
getsockopt
htonl
htons
inet_addr
inet_ntoa
ioctlsocket
listen
ntohl
ntohs
recv
recvfrom
select
send
sendto
setsockopt
shutdown
socket
FreeAddrInfoW
GetAddrInfoW
GetNameInfoW
WEP
WPUCompleteOverlappedRequest
WSAAccept
WSAAddressToStringA
WSAAddressToStringW
WSAAsyncGetHostByAddr
WSAAsyncGetHostByName
WSAAsyncGetProtoByName
WSAAsyncGetProtoByNumber
WSAAsyncGetServByName
WSAAsyncGetServByPort
WSAAsyncSelect
WSACancelAsyncRequest
WSACancelBlockingCall
WSACleanup
WSACloseEvent
WSAConnect
WSACreateEvent
WSADuplicateSocketA
WSADuplicateSocketW
WSAEnumNameSpaceProvidersA
WSAEnumNameSpaceProvidersW
WSAEnumNetworkEvents
WSAEnumProtocolsA
WSAEnumProtocolsW
WSAEventSelect
WSAGetLastError
WSAGetOverlappedResult
WSAGetQOSByName
WSAGetServiceClassInfoA
WSAGetServiceClassInfoW
WSAGetServiceClassNameByClassIdA
WSAGetServiceClassNameByClassIdW
WSAHtonl
WSAHtons
WSAInstallServiceClassA
WSAInstallServiceClassW
WSAIoctl
WSAIsBlocking
WSAJoinLeaf
WSALookupServiceBeginA
WSALookupServiceBeginW
WSALookupServiceEnd
WSALookupServiceNextA
WSALookupServiceNextW
WSANSPIoctl
WSANtohl
WSANtohs
WSAProviderConfigChange
WSARecv
WSARecvDisconnect
WSARecvFrom
WSARemoveServiceClass
WSAResetEvent
WSASend
WSASendDisconnect
WSASendTo
WSASetBlockingHook
WSASetEvent
WSASetLastError
WSASetServiceA
WSASetServiceW
WSASocketA
WSASocketW
WSAStartup
WSAStringToAddressA
WSAStringToAddressW
WSAUnhookBlockingHook
WSAWaitForMultipleEvents
WSApSetPostRoutine
WSCDeinstallProvider
WSCEnableNSProvider
WSCEnumProtocols
WSCGetProviderPath
WSCInstallNameSpace
WSCInstallProvider
WSCUnInstallNameSpace
WSCUpdateProvider
WSCWriteNameSpaceOrder
WSCWriteProviderOrder
Release filesHuorong System Diagnostics Toolkit Monitor that the sample execution will release the file and analyse its release behaviour in depth:
- Monitoring to write files
It looks like a file was written here but we don't know how it was done yet
- Since the sample is written in .net and not encrypted, it can be debugged at source level directly through dnspy.
Search and locate the execution code based on the previously monitored write file:
private void btn_crack_Click(object sender, EventArgs e)
{
try
{
this.Dosya_Sil(new string[]
{
"C:\\metasploit\\apps\\pro\\ui\\app\\views\\layouts\\application.html.erb",
"C:\\metasploit\\apps\\pro\\ui\\app\\controllers\\application_controller.rb",
"C:\\metasploit\\apps\\pro\\ui\\app\\models\\license.rb",
"C:\\metasploit\\apps\\pro\\engine\\app\\concerns\\metasploit\\pro\\engine\\rpc\\tasks.rb"
});
this.Dosya_Cikar("application", "C:\\metasploit\\apps\\pro\\ui\\app\\views\\layouts\\application.html.erb");
this.Dosya_Cikar("application_controller", "C:\\metasploit\\apps\\pro\\ui\\app\\controllers\\application_controller.rb");
this.Dosya_Cikar("license", "C:\\metasploit\\apps\\pro\\ui\\app\\models\\license.rb");
this.Dosya_Cikar("tasks", "C:\\metasploit\\apps\\pro\\engine\\app\\concerns\\metasploit\\pro\\engine\\rpc\\tasks.rb");
MessageBox.Show("Metasploit Crack Done!", "OK DONE", MessageBoxButtons.OK, MessageBoxIcon.Asterisk);
}
catch (Exception ex)
{
MessageBox.Show(ex.Message, "FAILED", MessageBoxButtons.OK, MessageBoxIcon.Hand);
}
}
Parsing:
Find the file, if it exists replace it, if it doesn't exist error-proof the file not found
Broken single step run to see monitoring:
Prove that the file was released by the code here and determine that there are no errors
Process monitoring
Collecting information after the software has been run
- Huorong System Diagnostics Toolkit
Filtering: Paths, Processes, Actions
Action Categories:
Execution Monitoring, File Monitoring, Registry Monitoring, Process Monitoring, Network Monitoring, Behavior Monitoring
Task Group:
Information Summary
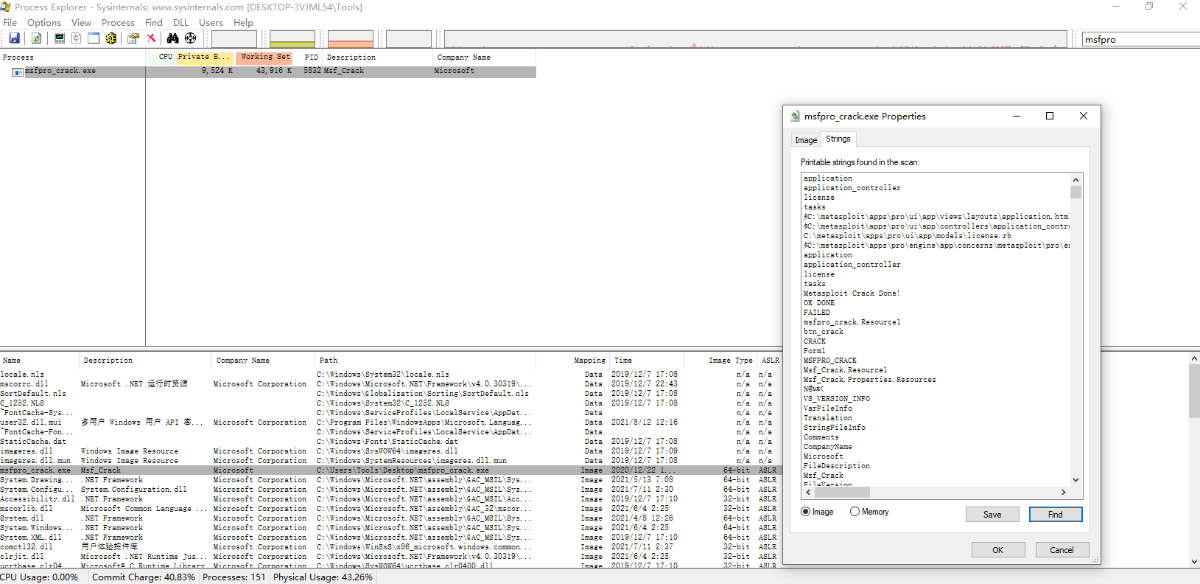
procexp(process explorerr)
Displays information about the handles and DLLs that have been opened or loaded by the process
Properties - string information.
dll information:

- suspicious resource information foundHandle information:
Based on the access mask, query the permissions obtained (normally it is more intuitive and easier to read to see the Decoded Access Mask) Tips for use:
To ensure that the display data is up-to-date, it is best to refresh manually, shortcut key F5.
You can determine the process status and type according to the background colour of the process, the specific colour represents the information shown below
Under the [Options] menu [Configure Colors] option
GlassWire
Monitoring the network behaviour of sample runs
- Already online:
- 192.168.86.131 is the attacker's IP
- TcpView
Monitoring Tcp and Udp information
After the sample has been run:
- Remote desktop view in progress:
Notification message gives away monitoring status (program has remote desktop service enabled)
- Autoruns
Compare autostart items before and after running to check if the new autostart items are malicious programs
- Process Monitor (Procmon)
Real-time monitoring of system information, such as registry, files, processes, network, etc.
Remote sample detection of system information:
- Remote desktop information for remote control samples.
Remote control sample file management information:
- Capsa Network Analyzer
Monitor network data and view details of:
Process IP information:
- Saw some outreach IP information (simulated attack IP in it), in the actual scenario, the actual attack IP will be identified based on multiple sources
Port analysis to locate
Some samples develop ports for malicious exploitation
- Use packet capture software to find out which processes are currently using a port normally
- Use the netstat command to query the PID of a process occupying a port
netstat -ano|findstr "port number"
Then query the occupied processes in conjunction with Task Manager or other process monitoring programs
Firewall-assisted analysis for location
Most malware will use the network for further attacks, such as remote control, remote command execution, remote download, remote file theft, etc. This is often the case when the firewall can monitor or capture the network link between the local and the attacking end and locate the malicious program based on this link or intercept it so that it cannot attack further.
- ProgCop
Monitoring remote connections: - View attachment 1521
Monitored a local link to a remote address (Client-built is the remote sample for this experiment) Monitored this process:
Saw some dangerous actions performed by this process (deleting/writing files, creating accounts, reading registry keys, etc.)

